
Why the topic is coming up right now
Mid-sized companies do not have a data problem in the sense of missing data. It has an access problem.
In 2024, Bitkom asked companies with 20 or more employees how far they tap their data potential. Only six percent answered “fully,” 42 percent said “rather little,” and another 18 percent said “not at all.” A survey by CIO and Computerwoche among 315 companies in German-speaking countries reached a matching conclusion in early 2026: the biggest obstacles to AI projects are not the algorithms but poor data quality at 30 percent and fragmented data landscapes at 28 percent.
In everyday work it looks like this: the question “what did this order actually cost us?” ties up three departments for two weeks. A considerable part of the monthly close consists of merging system exports by hand. Two departments present different numbers for the same matter, and the first half hour of a meeting goes into settling which one counts.
This is neither a leadership problem nor a matter of effort, but a structural one. Each of these systems is built for its own purpose, the ERP for processing, the CRM for sales. None of them is built to talk to the others.
What Databricks is
An image helps. If you think of company data as stock, that stock today sits spread across a dozen small storerooms, each with its own order, its own labels, and its own access rules. Anyone looking for something first has to know which storeroom to start in.
Databricks is the central warehouse, along with the administration that goes with it.
The platform takes on four tasks that together make up the actual value.
First: bring data together. The platform pulls data from the source systems regularly and automatically, without anyone triggering an export. A collection of snapshots becomes a continuous process.
Second: make data consistent. Raw data from operational systems is barely readable for people: cryptic field names, key values instead of plain text, the same company spelled three different ways. The platform prepares this data step by step until it becomes a data foundation in which “customer” from the sales system and “account receivable” from accounting demonstrably refer to the same company. This step is unspectacular and accounts for the bulk of the work. It decides whether the analyses will be correct later on.
Third: govern access. Who may see which data is defined in one place and applies everywhere. The technical term for this is governance: the ground rules for handling data. Permissions are held centrally and are taken from the existing user directory. They reach down to the individual row, so a sales director sees the numbers for their own area and management sees the whole picture, both from the same table. Traceability comes on top of that: for every metric it is documented where it comes from and how it was calculated. Only that makes it possible to put data in the hands of the whole company without losing control.
Fourth: provide binding metrics. Contribution margin, capacity utilization, days of inventory, win rate in sales: defined once, stored centrally, identical for everyone. Not as a number in a file, but as a rule that every analysis tool applies the same way.
Why this calls for a platform of its own
There are two common answers to the question of why what is already there is not enough.
“But we have Excel.” Excel is an excellent tool for analyses that one person runs once. It is a poor tool for numbers that a whole company is meant to rely on permanently. An Excel analysis is a snapshot, its logic sits in cell formulas, its upkeep depends on one person, and after being forwarded twice its origin can no longer be reconstructed.
“But we have analyses in the ERP.” Those show what is in the ERP. The commercially interesting questions, however, almost always cut across it: how does the sales effort recorded in the CRM relate to the actual margin from post-calculation? Which customers file complaints more often than average, and what does that cost? As soon as a question touches two systems, no single system can answer it.
What companies actually gain from it
The technology is a means to an end. The benefit shows up in four areas.
One number everyone agrees on. Contribution margin per order, capacity utilization per site, days of inventory per item: defined cleanly once, the same for everyone, current every morning. The effect shows not in the report but in meetings that start with the decision instead of with sorting out the data.
Answers across system boundaries. Only bringing the data together makes it possible to answer the questions that determine the bottom line: which orders look good in the costing and turn out badly in execution? With which customers does the order frequency drop before they leave? Where do purchase prices deviate systematically from the costing?
Less manual work in reporting. The effort that goes into exporting, reconciling, and formatting today largely disappears. This effect is the easiest one to quantify and therefore often the first proof that such a project pays off.
A solid foundation for AI. A public AI assistant knows the world but not a company’s order situation. The difference between a gimmick and a commercially relevant tool is access to company data that is ordered, clearly defined, and correctly permissioned. A data platform creates that foundation. The KfW study from February 2026 shows that this, and not AI itself, is where things stall: one in five mid-sized companies now uses AI, but alongside a shortage of skilled staff the study explicitly counts inadequate data foundations among the main obstacles.
Context: not a niche product
Databricks was founded in 2013 by researchers at the University of California, Berkeley, the same people who had previously developed one of the world’s most widely used open source technologies for data processing. According to the company, more than 20,000 organizations worldwide use the platform today.
Independent market observers are just as clear. In Gartner’s Magic Quadrant for AI platforms from June 2026, Databricks sits in the “Leaders” field, and for the second year running with the best rating on both dimensions: ability to execute as well as completeness of vision.
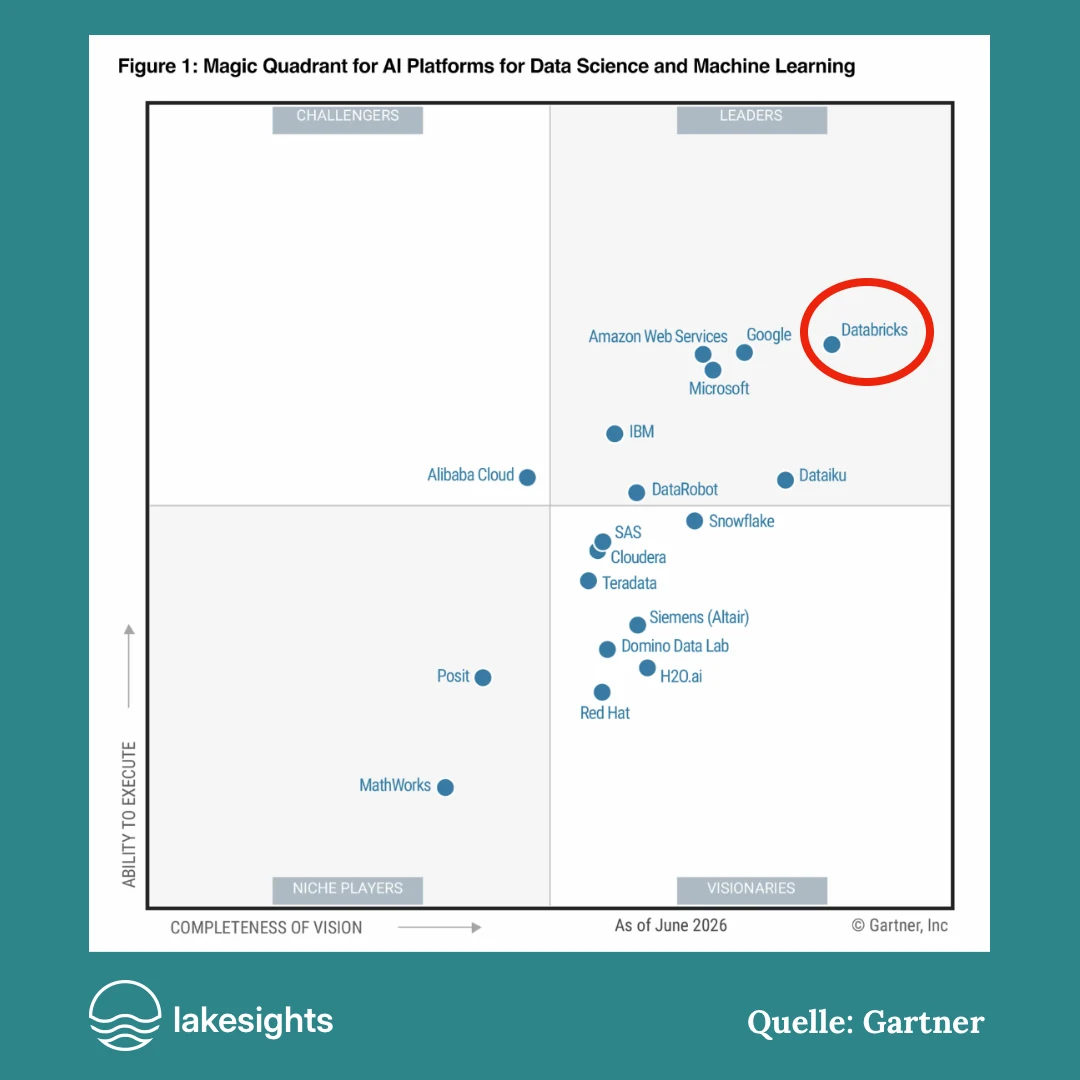
For a decision, a market overview like this does not replace an assessment of your own needs. But it answers a question that mid-sized companies rightly ask early on: whether the chosen technology will still carry them in five years. Choosing the leading vendor in a market buys more than today’s feature set; you grow along with its development. New capabilities are available as soon as they are needed, without having to rebuild the foundation.
Conclusion
Databricks is not another system that staff have to operate. It is the layer on which the data from the existing systems comes together, is made consistent, is secured, and is turned into binding metrics.
Whether that pays off is decided by no technology question but by a business one: are decisions being made worse than they could be today because the right numbers are not available in time or not reliable? Wherever that is the case, a data platform is not an IT project but an investment in the quality of decisions.